Public debt is usually presented as a single frightening number. A country owes 60%, 100% or 150% of its annual economic output, and the higher figure is assumed to represent the greater danger. But history repeatedly shows that debt-to-GDP alone cannot tell us whether a government is approaching a crisis.
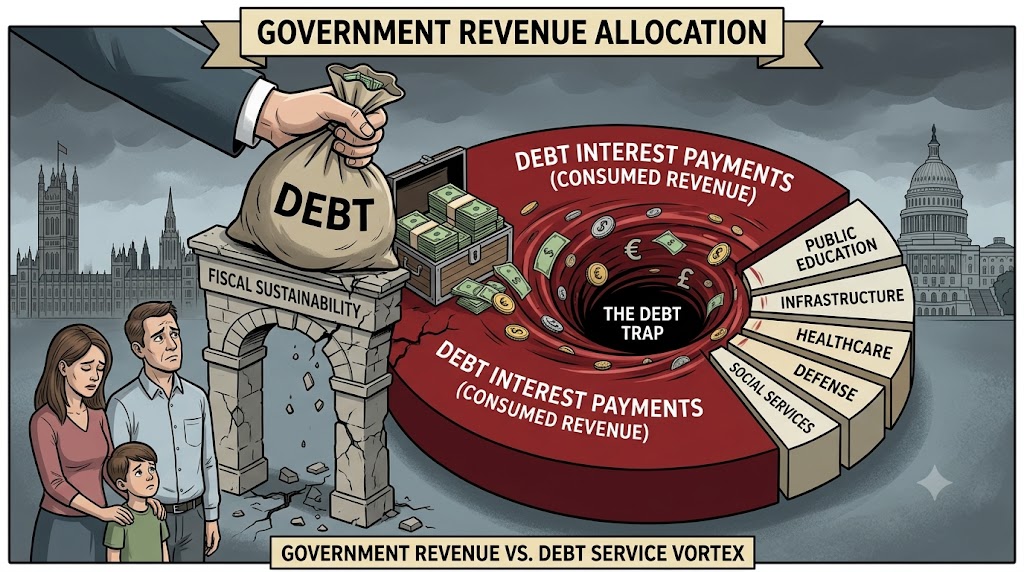
A government does not repay its debt directly from GDP. It services debt from the revenue it collects through taxes, duties, royalties and other sources. That is why interest payments as a share of government revenue provide a more practical view of immediate fiscal pressure.
If a government collects $100 and spends $10 on interest, it retains $90 for defence, healthcare, education, pensions, infrastructure and administration. If interest rises to $25, one-quarter of its usable income is committed before a single current public service is financed. The government must then raise taxes, reduce other spending or borrow again.
Even this ratio is not a complete warning system. A country’s ability to carry debt also depends on whether its debt is short-term or long-term, whether it is denominated in domestic or foreign currency, whether the economy is growing, whether investors will refinance maturing bonds and whether citizens believe that the government can collect revenue and manage public finances competently.
Britain demonstrates how extraordinarily high debt can remain manageable under strong fiscal institutions. Russia, Argentina and Greece show how countries can enter crises at lower debt levels when revenue, refinancing capacity, currency arrangements and institutional credibility deteriorate together. The United States and today’s developing economies show why this historical lesson is becoming increasingly relevant.
Britain: When Enormous Debt Did Not Produce Default
Britain entered the eighteenth century with public debt of approximately 22% of GDP. A century of wars then transformed its balance sheet. On the eve of the Napoleonic Wars, debt had already reached approximately 155% of GDP. After Waterloo, it was close to 180%, and the IMF’s historical database places it at 194.1% in 1822.
The burden on public revenue was enormous. During the major wars of the eighteenth and early nineteenth centuries, borrowing costs increased and debt servicing came close to two-fifths of annual government revenue. In other words, Britain was sometimes directing nearly £40 out of every £100 it collected towards servicing past borrowing.
Under a simple debt-ratio theory, Britain should have collapsed. It did not.
Britain had developed a financial system in which Parliament authorised taxes and borrowing, the Bank of England supported an organised government-bond market, and investors believed that future governments would continue honouring public obligations. The government could borrow primarily in sterling from a large domestic investor base and could spread repayment over long periods.
That did not make the debt painless. Taxes remained high, interest absorbed revenue that could have been used elsewhere, and governments regularly ran primary surpluses—meaning revenue exceeded non-interest expenditure—to bring the burden down. But Britain was not forced into a sudden foreign-currency repayment crisis or a continuous cycle of refinancing all its debt at once.
By 1913, the debt ratio had declined to approximately 28–29% of GDP. It rose again during the two world wars. During the interwar period, interest payments averaged approximately 25% of government receipts, and after the Second World War public debt reached approximately 249% of GDP. Yet Britain again avoided sovereign default and gradually reduced the ratio through economic growth, inflation, financial controls and sustained fiscal adjustment.
These numbers demonstrate why neither debt-to-GDP nor interest-to-revenue can be read in isolation. An interest burden near 40% of revenue is undeniably severe. Britain survived it because the state could collect taxes, borrow in its own currency, issue long-term debt and persuade investors that the obligations would continue to be honoured.
“Trust” in this context does not mean popularity or blind faith in the government. It means a practical expectation that institutions will collect revenue, publish credible accounts, manage liquidity, refinance obligations and preserve the government’s long-term solvency.
Britain’s success therefore came not from debt being harmless, but from combining institutional credibility with revenue capacity, long debt maturities and consistent fiscal management.
Russia: A Refinancing Crisis Before Debt Became Historically Exceptional
Russia’s 1998 crisis developed under very different conditions. Its debt was far below Britain’s historical peaks, but the Russian state had difficulty collecting enough reliable revenue to finance expenditure and service its obligations.
In 1997, reported federal revenue was approximately 10.8% of GDP, while cash revenue was only about 9.1% of GDP. Weak tax collection forced the government to depend heavily on borrowing. Much of this borrowing was conducted through short-term rouble-denominated treasury securities known as GKOs.
Short-term debt can become dangerous even when the total debt ratio appears moderate. If a ten-year bond matures, the government has years to prepare or refinance it. If a large volume of debt matures every few months, the government must repeatedly persuade investors to buy new securities. The state’s survival becomes dependent on continuous access to the market.
Russia increasingly borrowed to repay maturing obligations. Investors demanded higher yields as they became more concerned about fiscal deficits, political uncertainty and the government’s ability to defend the rouble. GKO yields remained above 50% during parts of the crisis and eventually exceeded 100% on an annualised basis. At such rates, issuing new debt to service existing debt made the underlying problem grow rapidly.
External shocks then exposed the weakness. The Asian financial crisis reduced investors’ willingness to hold emerging-market assets. Falling oil and commodity prices damaged Russia’s export earnings and fiscal position. Pressure on the exchange-rate regime intensified, while the short maturity of government debt left little time for gradual adjustment.
On 17 August 1998, Russia announced a restructuring and suspension of payments on specified rouble-denominated GKO and OFZ obligations. GKOs were short-term government treasury bills, while OFZs were longer-term rouble-denominated government bonds that generally paid interest through coupons. Russia also introduced a temporary moratorium on certain private external payments and allowed the rouble’s exchange-rate regime to break down. The currency subsequently fell sharply.
Russia’s experience was not simply a story of debt exceeding a particular percentage of GDP. Depending on the definition and exchange rate used, commonly cited pre-crisis debt estimates were broadly in the range of 50–60% of GDP—far below Britain’s post-war peaks. The immediate danger came from weak revenue collection, short maturities, extremely high refinancing costs, the exchange-rate commitment and disappearing market access.
Confidence did not collapse without reason. Investors responded to visible weaknesses in the government’s cash flow and financing structure. Russia had a solvency problem in the background, but the immediate trigger was a liquidity and refinancing crisis: too much debt had to be rolled over too quickly and at increasingly impossible interest rates.
Argentina: When Currency Rigidity Magnified the Interest Burden
Argentina’s 2001 default illustrates how debt can become unmanageable when recession, foreign-currency exposure and a rigid exchange-rate system operate together.
Under the convertibility arrangement introduced in 1991, one Argentine peso was fixed at one US dollar. The system initially helped stop hyperinflation and restored a degree of monetary credibility. But it also limited Argentina’s ability to respond to later economic shocks.
When the US dollar strengthened, the peso strengthened with it. Argentina became less competitive against countries whose currencies were weaker. Brazil’s 1999 devaluation placed additional pressure on Argentine exports. Meanwhile, Argentina had entered a recession in 1998, causing income and tax collections to weaken.
The deterioration can be seen clearly in interest payments as a share of government revenue.
| Year | Interest payments as a share of revenue |
|---|---|
| 1992 | 8.1% |
| 1998 | 11.0% |
| 1999 | 14.0% |
| 2000 | 16.4% |
| 2001 | 20.6% |
By 2001, more than one-fifth of government revenue was being consumed by interest. But the danger was greater than the ratio alone suggested.
A large part of Argentina’s debt was linked to foreign currency. The government could not create US dollars, and the currency board restricted its ability to expand the supply of pesos. Devaluation could have supported exports, but it would also have increased the peso value of dollar liabilities and undermined the promised one-to-one conversion.
The government was therefore trapped. Fiscal tightening weakened an economy already in recession. A weaker economy reduced tax revenue. Lower revenue increased concerns about debt sustainability. Those concerns raised borrowing costs and encouraged capital flight, weakening both government finances and the banking system.
By the end of 2001, Argentina’s public debt was around 60% of GDP under contemporary measurements. That was not low, but it was nowhere near Britain’s historical peak. Yet Argentina was much more vulnerable because it had less monetary flexibility, substantial foreign-currency exposure, falling revenue and diminishing access to refinancing.
In December 2001, the government stopped payments on a large portion of its debt. The fixed exchange-rate regime was abandoned soon afterward. Devaluation then caused the domestic-currency value of dollar debt to rise dramatically, while economic output contracted.
Argentina did not default merely because investors suddenly became distrustful. Confidence disappeared because investors could see that the combination of recession, declining revenue, currency rigidity and foreign-currency debt was becoming internally inconsistent.
The interest-to-revenue ratio captured the growing pressure on the budget, but the currency structure of the debt determined how quickly that pressure became a national crisis.
Greece: High Debt Inside a Monetary Union
Greece presents another variation. It joined the euro area in 2001 and gained access to much lower borrowing costs than it had historically enjoyed. Investors initially considered Greek government bonds only slightly riskier than bonds issued by other euro-area governments.
The cheaper financing concealed accumulating weaknesses. Between 2002 and 2009, Greece borrowed an average equivalent to approximately 8% of GDP a year. Public expenditure remained high, tax administration was weak, external deficits widened and official fiscal figures repeatedly understated the scale of the imbalance.
After the global financial crisis, investors became less willing to assume that every euro-area government carried approximately the same risk. Greece’s fiscal statistics were revised sharply. The 2009 general-government deficit was eventually placed at 15.4% of GDP, while public debt was revised to approximately 127% of GDP.
General-government revenue in 2009 was approximately 38.7% of GDP, while interest expenditure was close to 5% of GDP. On a comparable general-government basis, that meant interest absorbed approximately 12.9% of revenue:
The ratio was substantial but not, by itself, enough to explain the crisis. The deeper problem was that Greece could not issue its own currency. It borrowed in euros, but the Greek government did not control the European Central Bank and could not independently create euros to stabilise its bond market or devalue a national currency to restore competitiveness.
As doubts increased, Greek bond yields rose and market access disappeared. By May 2010, yields on ten-year Greek bonds had exceeded 12%. Greece then required financial assistance from the European Union, the European Central Bank and the IMF.
Greece did not announce a conventional unilateral sovereign default in 2010. In 2012, however, privately held Greek bonds underwent a major restructuring. Eligible investors accepted a 53.5% reduction in the face value of their bonds, along with longer maturities and lower effective values. The restructuring reduced recorded public debt by approximately €62.4 billion, although official assistance and economic contraction meant that Greece’s overall debt problem did not immediately disappear.
In 2015, Greece also temporarily failed to make a scheduled payment to the IMF, becoming the first advanced economy to enter arrears to the Fund before later clearing them.
Greece’s experience shows that membership in a trusted monetary system can initially lower borrowing costs, but it does not eliminate fiscal risk. Greece benefited from the credibility of the euro, yet its national institutions did not maintain fiscal accounts, revenue collection and expenditure at a level consistent with that borrowing privilege.
Today, Greece is no longer in the same immediate crisis. It has regained investment-grade ratings from major agencies, returned to bond markets and substantially lengthened the maturity of its debt. A large share of its obligations is owed to official European creditors on relatively favourable terms. Consequently, its debt ratio can remain high without producing the same near-term refinancing pressure it faced in 2010.
This improvement reinforces the central argument: the amount of debt matters, but the maturity, interest rate, creditor structure and credibility of fiscal management determine whether that debt becomes an immediate crisis.
The World Today: The United States and Growing Pressure on Developing Countries
The United States occupies a unique position in the modern debt system. Treasury securities form the foundation of global financial markets, and the dollar is the world’s principal reserve and transaction currency. The federal government borrows overwhelmingly in dollars, while the Federal Reserve has the capacity to provide dollar liquidity to the financial system.
This greatly reduces the risk of an Argentina-style foreign-currency crisis. It does not, however, remove the economic cost of interest.
The movement of US interest payments relative to revenue shows how fiscal pressure can remain subdued for years and then rise rapidly. In the table, debt held by the public means federal debt held outside federal government accounts. It excludes Treasury securities held by federal trust funds.
| Fiscal year | Economic position | Federal revenue | Net interest | Interest as share of revenue | Debt held by the public |
|---|---|---|---|---|---|
| 2007 | Before the global financial crisis | About $2.57tn | About $237bn | 9.2% | About $5.0tn |
| 2009 | Financial crisis and recession | About $2.11tn | About $187bn | 8.9% | About $7.5tn |
| 2019 | Before COVID-19 | About $3.46tn | About $375bn | 10.8% | About $16.8tn |
| 2020 | Pandemic year | About $3.42tn | About $345bn | 10.1% | About $21.0tn |
| 2025 | Higher-rate refinancing period | About $5.23tn | About $970bn | 18.5% | About $30.2tn |
| 2026 | CBO projection | About $5.6tn | About $1.0tn | About 18% | About 101% of GDP |
| 2036 | CBO projection | About $8.3tn | About $2.1tn | About 25% | About 120% of GDP |
The figures reveal an important time lag. Federal debt rose rapidly after the 2008 financial crisis, but interest costs did not rise proportionately because interest rates fell. The same thing happened during the first year of COVID-19. Debt held by the public rose from approximately 79% of GDP in 2019 to around 100% in 2020, but net interest remained approximately 10% of federal revenue.
Low rates temporarily insulated the budget from the cost of the larger debt stock. They did not permanently eliminate that cost.
As inflation increased and the Federal Reserve raised interest rates, newly issued Treasury securities carried higher yields. Older low-rate debt gradually matured and had to be replaced with more expensive borrowing. Net federal interest consequently increased from $345 billion in 2020 to approximately $970 billion in 2025—an increase of about 181%.
By the end of the 2025 fiscal year, debt held by the public was approximately $30.2 trillion, close to 99% of GDP. Intragovernmental obligations added roughly $7.3 trillion, taking gross federal debt to approximately $37.5 trillion. These measures should not be used interchangeably: debt held by the public is generally more relevant when analysing market financing, while gross debt includes obligations between parts of the federal government.
An interest-to-revenue ratio approaching 20% is alarming. It means almost one dollar in every five collected by the federal government is being used for net interest. In 2025, net interest exceeded federal spending on national defence. Under the Congressional Budget Office’s 2026 baseline, debt held by the public is projected to rise from approximately 101% of GDP in 2026 to around 120% in 2036, while net interest could approach one-quarter of federal revenue.
The United States is unlikely to face the same mechanical default risk as a country borrowing heavily in a foreign currency. But it faces a different danger: interest can gradually crowd out public investment, defence, social programmes and the government’s ability to respond to the next crisis. Attempts to create additional money to eliminate the real burden would risk inflation, currency depreciation and damage to the very credibility that makes Treasury borrowing comparatively safe.
Britain’s post-COVID experience gives another warning. Governments initially borrowed at extremely low rates, preventing interest costs from rising in proportion to pandemic debt. But that protection was temporary. Britain was particularly exposed because a significant portion of its debt was linked to inflation. As inflation and interest rates rose, UK debt-interest spending reached a post-war high of £111.6 billion, or 4.3% of GDP, in 2022–23.
The position is more difficult for many developing countries. They generally collect less revenue relative to the size of their economies, face higher borrowing rates and may depend on debt denominated in dollars, euros or other foreign currencies.
The World Bank reports that, among 89 low- and middle-income countries, 21 spent more than 20% of government revenue on interest in 2024, compared with only nine in 2017. Fourteen countries exceeded 25%, while 33 spent more than 15% of revenue on interest.
For a country spending 25% of revenue on interest, the immediate problem is not an abstract debt ratio. It is that only three-quarters of revenue remains for salaries, pensions, healthcare, education, security and infrastructure. If the government borrows again to finance those expenditures, future interest costs can consume an even larger share of revenue.
Foreign-currency debt magnifies the problem. Suppose one unit of domestic currency originally buys one dollar. If its dollar value falls by 25%, it will buy only $0.75. The government would then need approximately 1.333 units of domestic currency to obtain the same dollar:Thus, a 25% fall in the currency’s dollar value produces a 33.3% increase in the domestic-currency cost of purchasing dollars for debt service.
During 2022–24, low- and middle-income countries paid external creditors approximately $741 billion more in principal and interest than they received in new external financing. That represents a net transfer of resources out of developing economies—not simply an accounting increase in their debt stock.
The Real Measure of Fiscal Strength
The lesson from these cases is not that one interest-to-revenue ratio automatically predicts default. There is no universal threshold at which every government fails. A country paying 20% of revenue in interest on long-term domestic-currency debt may be safer than a country paying 12% on short-term foreign-currency debt that must be refinanced during a currency crisis.
But the ratio remains one of the clearest measures of fiscal pressure because it connects debt directly to the resources available to the government. Debt-to-GDP tells us the size of the obligation relative to the economy. Interest-to-revenue tells us how much that obligation is already eating into the budget.
A country’s true fiscal position therefore rests on three connected foundations. It must maintain enough short-term liquidity to meet obligations when they fall due. It must preserve long-term solvency by ensuring that debt does not grow permanently faster than its capacity to generate revenue. And it must maintain institutional credibility so that citizens pay taxes and investors remain willing to refinance sustainable obligations at reasonable rates.
Reputation cannot substitute for sound finances forever. But careful financial management can build a reputation that lowers borrowing costs, extends maturities and gives governments time to respond to shocks. Poor management does the opposite: it turns refinancing into a recurring emergency and causes confidence to disappear exactly when it is most needed.
Britain survived historically extraordinary debt because its financial and political institutions supported taxation, long-term borrowing and continued repayment. Russia failed when weak revenue and short-term refinancing collided. Argentina failed when recession and foreign-currency obligations made its fixed exchange rate unsustainable. Greece lost market access when unreliable fiscal management was exposed inside a monetary union. The United States remains uniquely protected by the dollar and the depth of its financial markets, but its rapidly rising interest bill shows that even the strongest borrower cannot treat revenue as unlimited.
The most useful question is therefore not simply, “How much does the country owe?” It is: “How much of its revenue is already being consumed by that debt, how soon must the debt be refinanced, in what currency must it be repaid, and do its institutions have a credible plan to manage it?”
Those questions reveal far more about fiscal health than the debt ratio alone.
Sources
Historical estimates and fiscal data are drawn from publications and databases maintained by the UK Office for Budget Responsibility, International Monetary Fund, World Bank, US Treasury, US Congressional Budget Office and European Commission.
Leave a Reply